
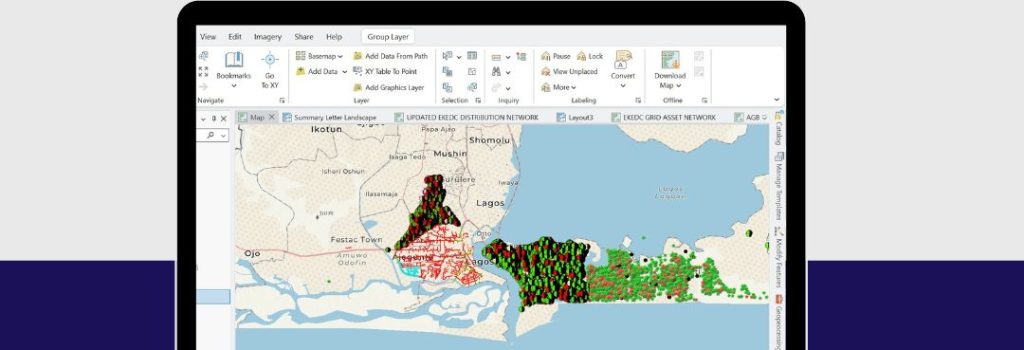
Introduction
Power distribution in Lagos, Nigeria—Africa’s largest city with over 20 million residents —is a complex and high-pressure undertaking. Utilities face constant challenges such as network losses, equipment failures, unplanned outages, and customer service bottlenecks. Traditional paper-based systems and siloed databases limit visibility and slow down decision-making.
Geographic Information Systems (GIS) provide a powerful solution, allowing utilities to visualize assets spatially, link operational data to locations, and make data-driven decisions in real time. This project implemented a comprehensive GIS framework to modernize asset management, outage response, customer mapping, and long-term planning in a Lagos distribution utility.
Project Overview
⦁ The project covered the entire low-voltage and medium-voltage network of a Lagos distribution utility, which included:
⦁ 15,000+ distribution assets (transformers, feeders, substations).
⦁ Over 600,000 customers spread across residential, commercial, and industrial areas.
⦁ A service territory with dense urban neighborhoods, industrial estates, and peri-urban communities.
Challenges before GIS adoption include
⦁ Outdated or missing asset records.
⦁ Difficulty locating faulty equipment quickly.
⦁ Poor alignment of customer accounts with transformer loads (leading to overloading and energy losses).
⦁ Fragmented reporting between departments (operations, billing, and customer service).
The Goal
The objectives of the GIS deployment were:
1. Build a centralized geospatial database of all network assets.
2. Improve fault detection and outage response times.
3. Enhance field crew efficiency through mobile mapping and real-time updates.
4. Integrate GIS with SCADA, billing, and outage management systems for a unified operational view.
5. Provide planners with tools to simulate network expansion, forecast demand, and reduce technical losses.
6. Improve regulatory reporting and compliance with accurate, auditable data.
GIS is the only technology that actually integrates many different subjects using geography as its common framework.
-- Jack Dangermond Tweet
My Process
1. Data Collection & Asset Digitization
⦁ Field surveys conducted with GPS devices to capture accurate transformer, feeder, and pole locations.
⦁ Historical paper maps and Excel databases were digitized into the GIS system.
2. Data Cleansing & Integration
⦁ Removed duplicate and outdated records.
⦁ Linked GIS to SCADA alarms for outage visualization.
⦁ Mapped billing/customer accounts against the nearest distribution transformers.
3. System Design
⦁ Developed custom GIS dashboards for:
⦁ Control Center Operators – real-time outage maps.
⦁ Field Engineers – mobile work orders and asset health updates.
⦁ Planners – capacity maps for expansion projects.
4. Field Deployment
⦁ Provided field crews with mobile GIS apps for fault reporting, asset inspections, and live updates.
⦁ Enabled photo uploads for transformer inspections and hazard reporting.
5. Training & Change Management
⦁ Conducted training for operators, engineers, and customer service staff.
⦁ Established GIS “champions” in each department to drive adoption.
6. Continuous Improvement
⦁ Built workflows for regular data updates.
⦁ Integrated IoT-enabled smart meters and sensors for real-time monitoring.
The Solution
The final GIS solution included:
a. Centralized Asset Database – all transformers, feeders, and substations mapped with GPS coordinates.
b. Mobile Applications – field teams used GIS apps to update asset status, report outages, and close work orders.
c. Outage Management Integration – SCADA alarms automatically updated GIS outage maps, showing customers affected.
d. Customer Mapping – every customer account linked to a transformer, enabling load balancing and revenue protection.
e. Decision Support Tools – planners used GIS layers to forecast demand growth, optimize feeder loading, and identify expansion needs.
The Result
A. 40% reduction in outage response times due to faster asset location and fault isolation.
B. 25% improvement in preventive maintenance efficiency as assets could be tracked, inspected, and scheduled systematically.
C. 15% increase in revenue recovery by aligning customer billing with accurately mapped transformers, reducing energy theft and unmetered connections.
D. Improved customer satisfaction, with better communication on outage locations, restoration timelines, and service reliability.
E. Enabled compliance with regulatory reporting requirements by providing accurate, spatially-referenced data on infrastructure and performance.
The Result
The GIS implementation transformed the Lagos power distribution utility into a modern, data-driven enterprise. Key impacts included:
⦁ Operational Visibility – managers could see the health of the entire grid at a glance.
⦁ Efficiency Gains – field engineers spent less time locating assets and more time fixing problems.
⦁ Revenue Assurance – mapping customers to assets reduced losses from unbilled energy.
⦁ Strategic Planning – enabled long-term infrastructure investment decisions based on real demand patterns.
⦁ Future Readiness – laid the foundation for smart grid, digital twin, and predictive analytics projects.