
Introduction
Pipelines are the quiet backbone of the energy industry. Long before a litre of petrol reaches a filling station or a cylinder of cooking gas reaches a kitchen, that product has already travelled hundreds of kilometres through a buried, largely invisible network of steel and pressure. In a country like Nigeria, where pipeline right-of-way often crosses farmland, rivers, informal settlements, and rapidly urbanising corridors, the operational stakes are high — a single undetected leak or an unmanaged encroachment can mean lost revenue, environmental damage, or worse.
As an Operations Technology manager working in GIS, I find pipeline asset management one of the most demanding — and most rewarding — applications of spatial technology. It is not just about drawing lines on a map; it is about building a living, queryable model of every valve, weld, coating segment, and cathodic protection station along the route, and using that model to drive decisions from the control room to the field crew.
What is a Pipeline GIS and Why Does it Matter?
A pipeline GIS is a spatially referenced digital model of the entire transmission and distribution network — from the flow station or export terminal, through trunk and feeder lines, down to delivery points at refineries, depots, or industrial consumers. Unlike a paper alignment sheet or a static as-built drawing, a GIS keeps every asset geo-located and attributed, so operators can query “what pipe is under this location, what is it made of, and when was it last inspected” in seconds rather than days.
“A pipeline is not just a pipe in the ground — it is a chain of thousands of individually trackable assets, each with a position, a condition, and a story that GIS is built to tell.”
— Okemefuna Nwabudike
The Pipeline Architecture: Source to Delivery Point
A well-structured pipeline network follows a hierarchical layout. Crude or gas originates at the wellhead or flow station, moves through gathering lines to a processing or compressor station, and then travels along the trunk transmission line — the high-pressure backbone — before branching into distribution laterals that reach refineries, depots, or end users. Each of these segments carries different design pressures, materials, and inspection regimes, which is precisely why spatial context matters at every handoff point.
GIS as the Backbone of Pipeline Asset Management
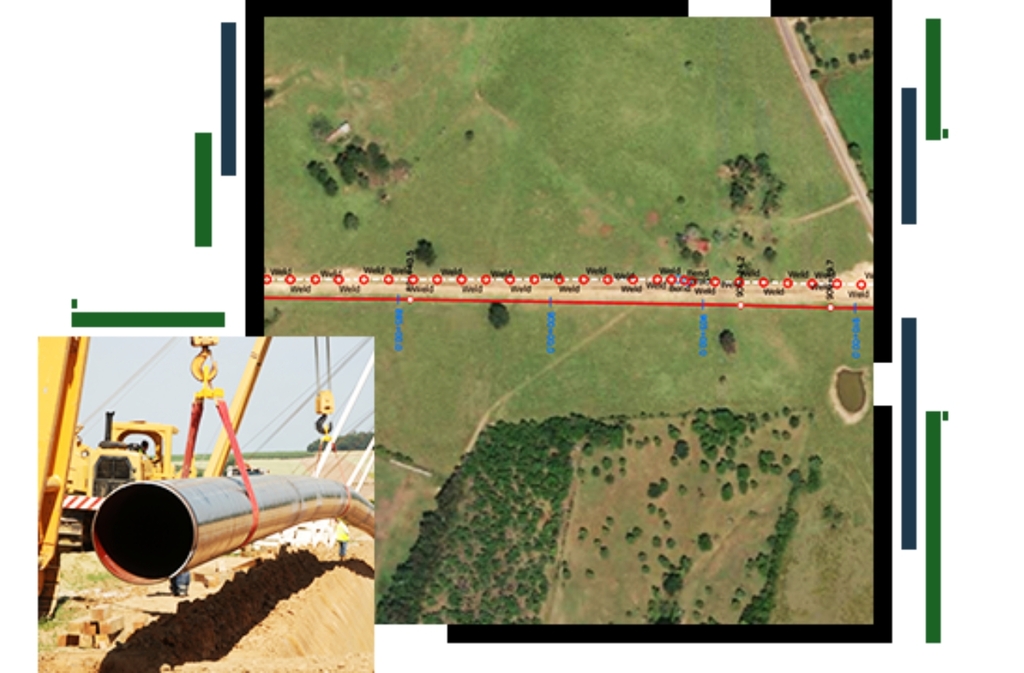
For pipeline operations, GIS is not an add-on report — it is the operational system of record. A mature GIS platform maintains a digital twin of the network: pipe centrelines with wall thickness, coating type, and installation date; valve and tie-in points as geo-referenced features with maintenance histories; pig launcher and receiver stations linked to inspection run data; and right-of-way corridors overlaid with land use, population density, and environmental sensitivity layers.
In practice, every kilometre-post along the trunk line becomes a linear referencing point, allowing an inline inspection anomaly reported “1.4km downstream of KP 220” to be instantly translated into an exact GPS coordinate, nearest access road, and responsible maintenance team — no manual cross-referencing required.
GIS Operational Value: Beyond the Map
The operational payoff of pipeline GIS shows up across four domains.
1) Route planning and right-of-way management — Spatial overlays of terrain, waterbodies, and settlements let planners select routes that minimize crossings, land acquisition cost, and environmental exposure before a single metre of pipe is laid.
2) Integrity and leak management — When a pressure drop or SCADA alarm is flagged, a GIS-linked system can spatially narrow the search to a specific segment between two valves, cutting response time from hours to minutes.
3) Corrosion and inspection management — Cathodic protection readings, pig run anomalies, and coating survey results are all plotted spatially, so degradation hotspots become visible as clusters rather than buried in a spreadsheet.
4) Encroachment and third-party damage prevention — GIS enables automated alerts when construction permits, farming activity, or new structures are detected within the right-of-way buffer, protecting both the public and the asset.
“A pipeline network without GIS is a liability waiting to surface. The map is not a record of the past — it is the operator’s early-warning system.”
— Okemefuna Nwabudike
Conclusion:
Managing oil and gas pipeline assets across dispersed, often difficult terrain demands more than sound engineering — it demands spatial discipline. GIS turns a buried network of pipes, valves, and stations into a structured, queryable, and analytically powerful asset base. That is what separates reactive, incident-driven maintenance from proactive pipeline integrity management.
This is a demonstrative scenario, not a real operating network, but drawing on my background in operations technology and asset management, I have modelled this structure to illustrate how effective a GIS-led approach can be for pipeline asset management.
#gis #assetmanagement #oilandgas #pipelineintegrity #operationstechnology #okemefuna #okemefunanwabudike